
Few numbers are read as often, or understood as loosely, as the chance of rain. You check it before a walk, a wedding or a school run, and you make a decision based on it. Ask a few people what “40% chance of rain” actually means, though, and you will hear several different answers.
Some think it means it will rain for 40% of the day. Others think it means 40% of the town will get wet. A few assume it is a measure of how heavy the rain will be. None of these is quite right. The real definition is simple once it is laid out, and knowing it makes the forecast far more useful.
The definition, in plain terms
Forecasters call the number the probability of precipitation, often shortened to PoP. In the definition used by the US National Weather Service, it is the chance that measurable precipitation will fall at any given point in the forecast area during the forecast period.
Each part of that sentence matters, so it is worth taking them one at a time.
Measurable precipitation means at least a small, fixed amount: in the US, one hundredth of an inch, which is about a quarter of a millimetre. A few drops that barely darken the pavement do not count.
At any given point means a single spot, such as your garden or your office, and not the whole region.
In the forecast area means the town, county or grid square the forecast covers.
During the forecast period means the window of time the number applies to, often a 12-hour block such as “this afternoon” or “tonight”, or a single hour in many phone apps.
So a 40% chance of rain tonight means that, at your location, there is a 4 in 10 chance of getting at least a measurable amount of rain at some point during the night. It says nothing directly about how long it will rain or how hard.
Why the time window matters
The same weather can produce very different percentages depending on the window. A 20% chance in each hour of an afternoon adds up to a considerably higher chance of rain at some point during the afternoon as a whole. This is why an hourly forecast in an app can show modest numbers all day while the daily summary shows a much higher one. Both can be right at once.
Confidence times area
Forecasters sometimes explain the number with a short formula. The probability of precipitation equals the forecaster’s confidence that rain will develop somewhere in the area, multiplied by the fraction of the area expected to receive it.
Two quite different situations can produce the same answer.
A confident forecast of patchy showers. The forecaster is almost certain that showers will form, but expects them to hit only about 40% of the area. Confidence close to 100% times an area of 40% gives roughly 40%.
An uncertain forecast of widespread rain. A band of rain might arrive, and if it does it will cover the whole area, but the forecaster is only about 40% sure it will get that far. Confidence of 40% times an area of 100% also gives 40%.
In both cases, your own chance of getting wet at any single spot is about 4 in 10. What the day feels like will be very different, though. In the first, it is almost certain to rain somewhere nearby, and you may watch a shower soak the next street while you stay dry. In the second, it is more of an all-or-nothing day: either everyone gets wet or nobody does.
The percentage tells you how likely you are to get wet. The words beside it tell you what kind of day it will be.
Read the words next to the number
Because the percentage alone cannot distinguish between those situations, the words in the forecast carry a lot of information. Many forecasts pair the number with a short description, and it pays to read it.
Showers
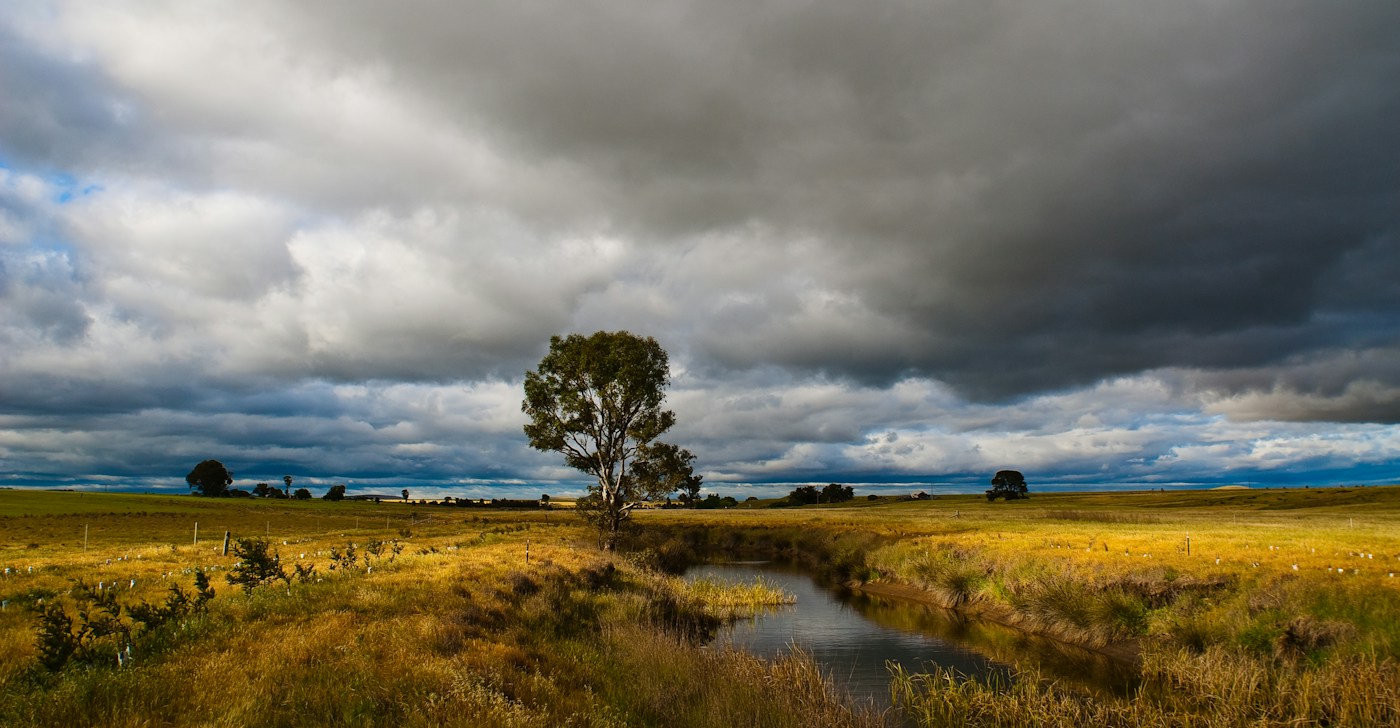
“Scattered showers” or “isolated showers” usually describe convective weather. Warm air rises, clouds build, and individual showers pop up and drift across the landscape. They are often short and can be heavy, with sunshine in between. Whether you get wet is partly luck, and the chance for any single spot rarely gets very high even when the day is showery overall.
Rain from a front
“Rain spreading from the west” or “a band of rain arriving this evening” usually describe a weather front, a boundary between air masses that tends to bring a more organised stretch of cloud and rain. Here the main uncertainty is often timing. If the front arrives during the period, almost everyone gets rain. If it is slower than expected, almost nobody does.
Ellie, a wedding planner who works mostly outdoors, has learned to treat these differently. On a showery day with a moderate chance, she makes sure there is somewhere to shelter for twenty minutes and carries on. On a frontal day, she watches the timing closely, because the difference between rain at four o’clock and rain at seven decides whether the ceremony can stay outside.
How forecasts are checked
A single probability forecast can never be proved right or wrong on its own. If the forecast said 40% and it rained, that was fine: things that are 40% likely happen all the time. If it stayed dry, that was also fine.
Forecasts are therefore judged over many days. The key idea is calibration, sometimes called reliability. Take every occasion on which a forecaster said 40%. If the forecasts are well calibrated, measurable rain should have fallen on roughly 40% of those occasions. The same should hold for 10%, 70% and every other value.
Reliability and sharpness
Meteorologists plot this on a reliability diagram, which compares the forecast probability with how often the event actually happened. A perfectly calibrated forecaster’s points sit on a straight diagonal line. Points below the line mean rain happened less often than forecast, so the forecaster was overstating the chance.
Calibration is not the only thing that matters. A forecaster who said 30% every single day in a place where it rains on 30% of days would be perfectly calibrated and almost useless. Good forecasts are also sharp, meaning they move confidently towards high or low values when the situation allows. Scores such as the Brier score combine both qualities into a single measure of how close the probabilities were to what happened.
Not every forecast source is equally well calibrated. Some prefer to lean towards predicting rain, on the reasoning that people forgive a dry day with an umbrella more readily than a soaking without one. If you notice that your usual app’s rain forecasts often come to nothing, it may be doing this.
Where the numbers come from: ensembles
Modern forecasts start with computer models that simulate the atmosphere. The model takes the current state of the weather, gathered from satellites, weather balloons, ground stations, aircraft and ships, and calculates how it will change over time.
The problem is that the starting data is never perfect. There are gaps between observations, and every measurement has small errors. The atmosphere is also chaotic, meaning tiny differences at the start can grow into large differences a few days later.
Ensemble forecasting deals with this by running the model many times rather than once. Each run, called a member, starts from slightly different conditions that are all consistent with the observations, and some ensembles also vary details of the model itself. The result is a spread of possible futures instead of a single answer.
If most members bring rain to your area tomorrow afternoon, the forecast chance is high. If only a few do, it is low. When the members agree closely, forecasters can be confident. When they diverge, uncertainty is high, and that is useful information too. Forecasters then combine the ensemble with other model output, statistical corrections based on past performance and their own judgement to produce the published figure.
Making decisions with a percentage
A probability is only useful if you can act on it, and there is no single threshold that suits everyone. The right choice depends on what rain would cost you and what it would cost to prepare.
A simple way to think about it: compare the cost of protecting yourself with the loss you would suffer if you did not and it rained. Carrying an umbrella costs almost nothing, so it makes sense to take one even at a fairly low chance. Moving a large outdoor event into a hall might cost a deposit and a lot of effort, so it makes sense only when the chance is high or the loss from rain would be severe.
Economists and meteorologists describe this as a cost and loss ratio. If protecting yourself costs a small fraction of what rain would cost you, it is worth protecting yourself at low probabilities. If protecting yourself costs nearly as much as the rain would, it is worth doing only when rain is very likely.
Marcus, a painter and decorator who does a lot of exterior work, uses exactly this kind of reasoning without the jargon. Fresh exterior paint can be spoiled by rain before it dries, and redoing the job costs him a day. He will start an outside wall only when the chance of rain for the afternoon is low and the description does not mention showers building. For indoor jobs, he does not check the forecast at all.
A few practical habits
Check which time window the percentage covers before comparing forecasts.
Read the description as well as the number, especially the difference between showers and a band of rain.
Look again closer to the time. Forecasts for the next few hours are usually much more reliable than those for several days ahead.
Use a radar map on showery days to see where the showers actually are and which way they are moving.
A small number with a lot inside it
The chance of rain packs a surprising amount into one figure: a point, a period, a threshold, and the combined judgement of models and forecasters about both whether rain will form and where it will fall. It will never tell you for certain whether you will get wet, because the atmosphere does not allow that kind of certainty.
What it can do, when you read it properly, is tell you how worried to be. Pair the number with the words beside it and the time it covers, weigh it against what rain would actually cost you, and a vague percentage becomes a practical guide to the day.

Written by
Nadia Ferreira
Nadia writes about the science of ordinary life, from weather forecasts to memory. She trained as a meteorologist and still checks the radar before she checks her messages.
